

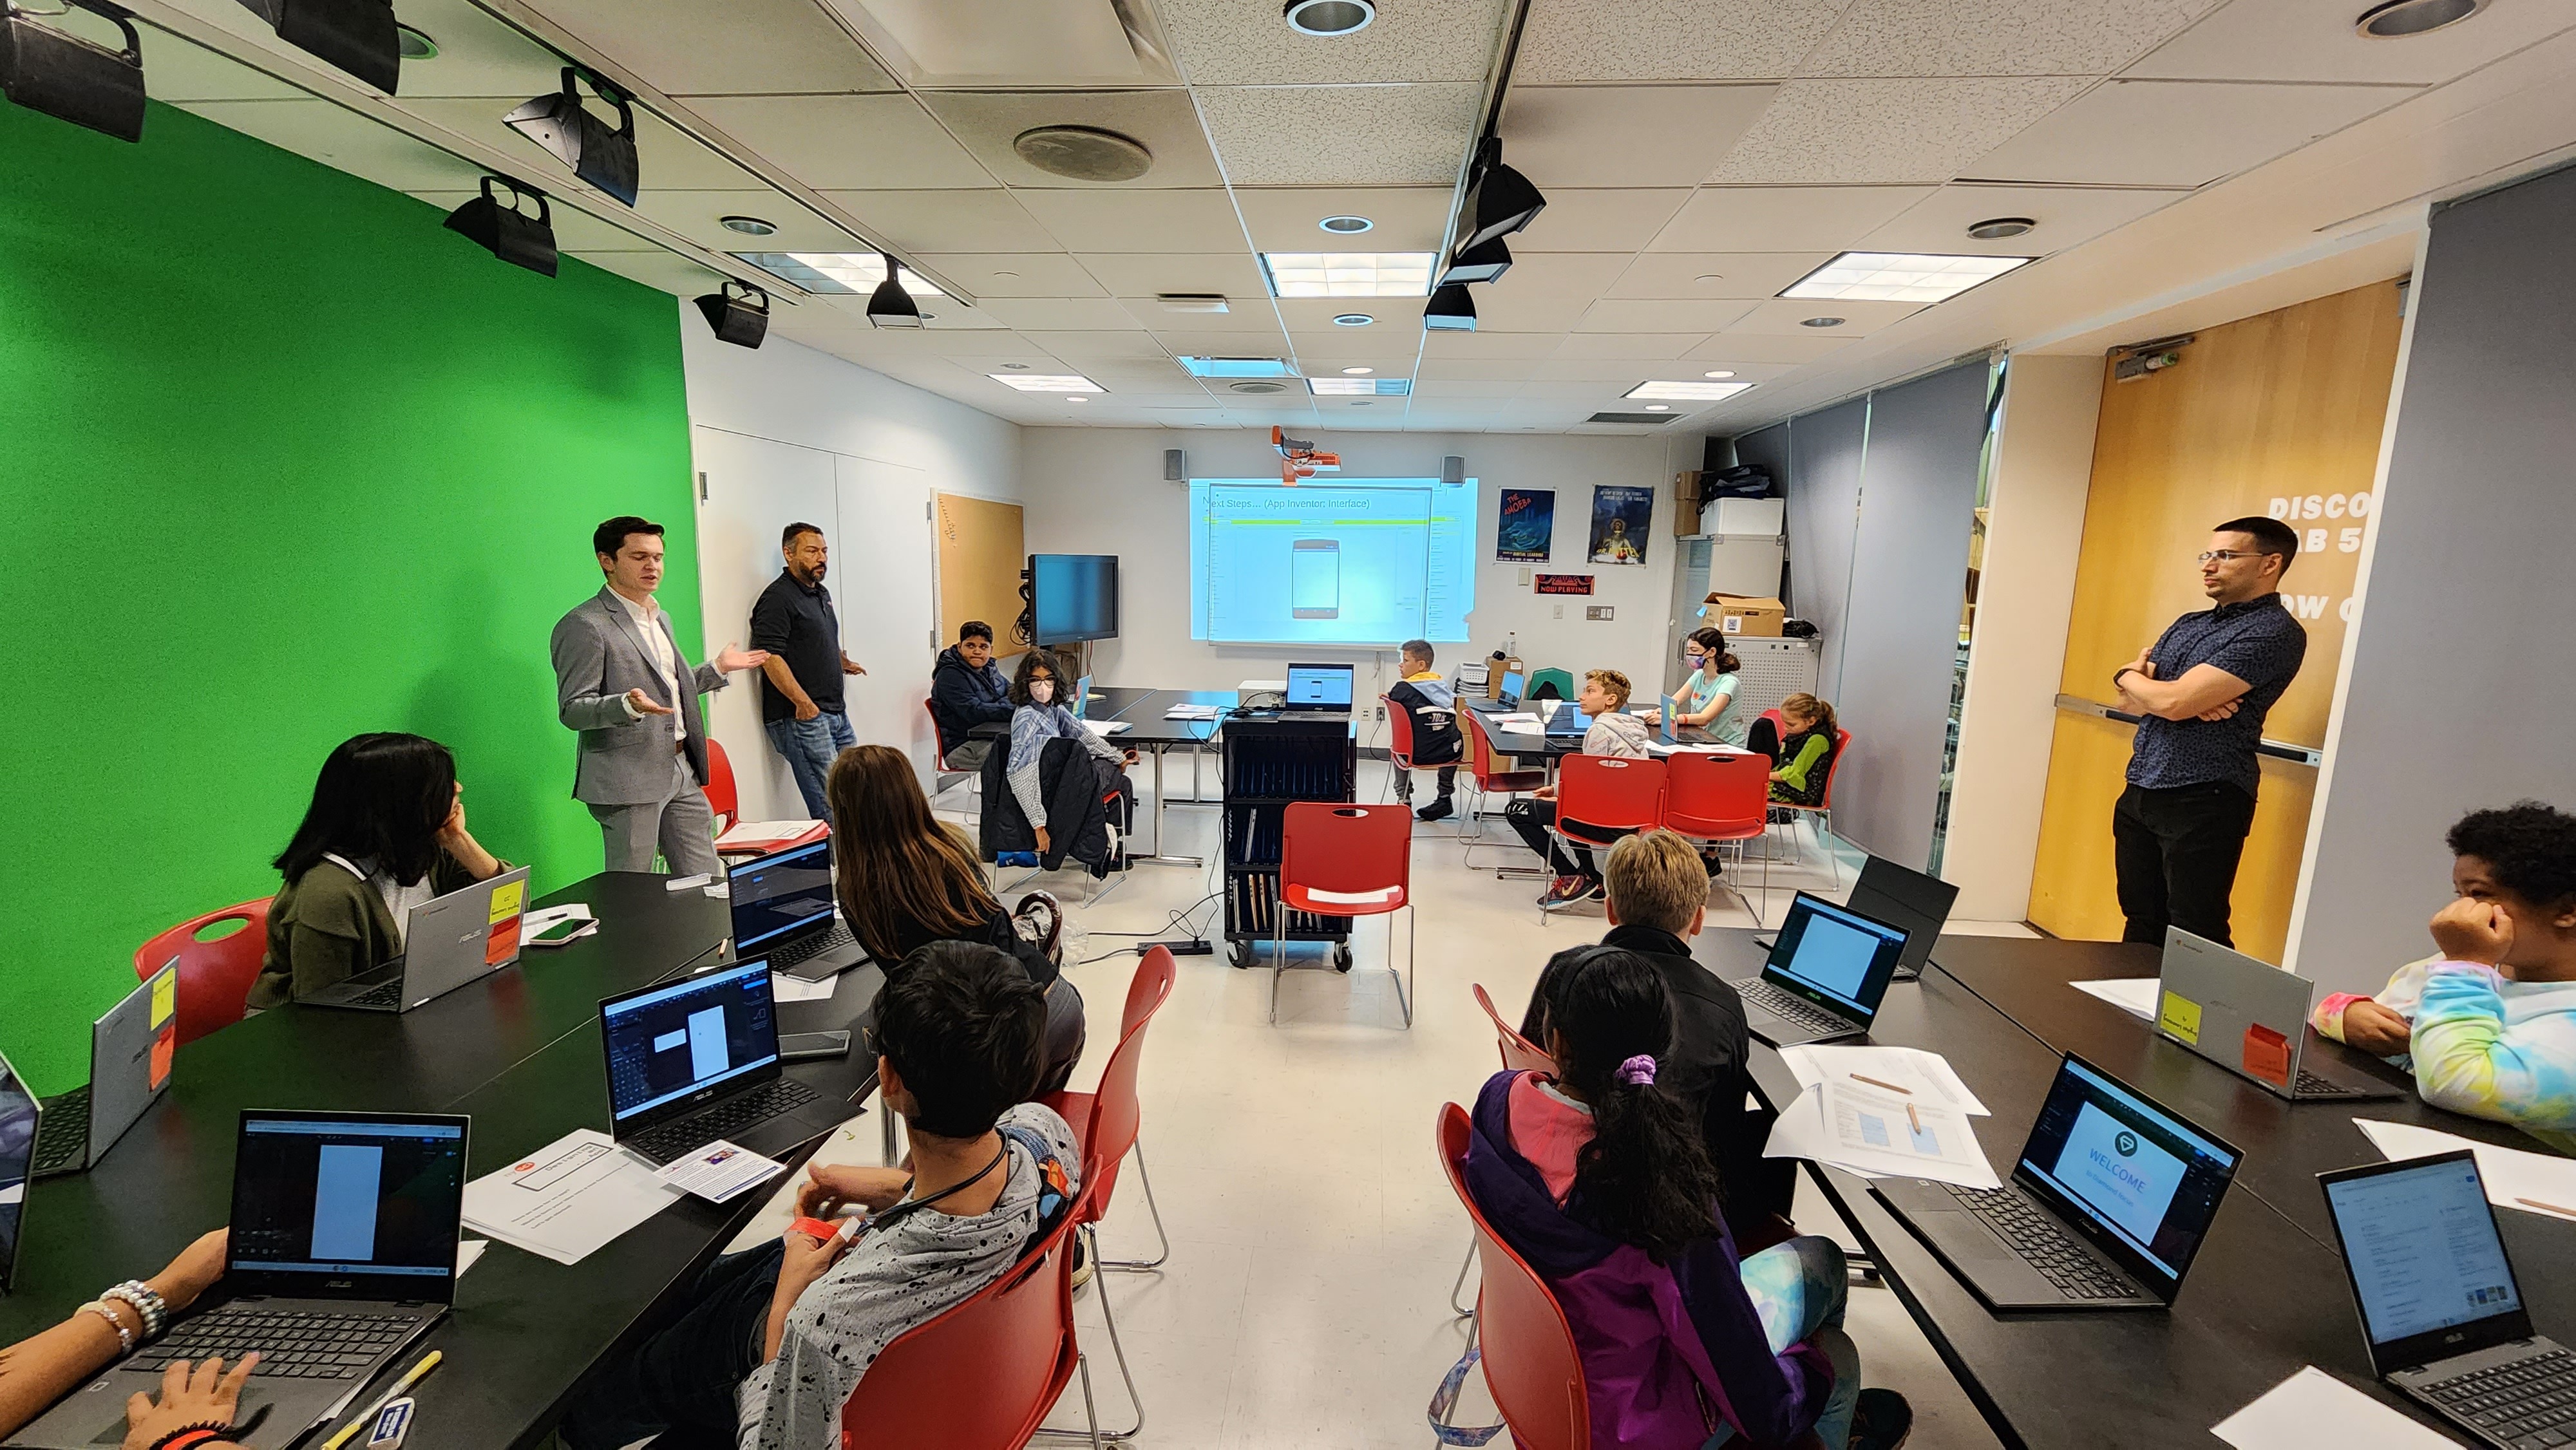

NYSCI Hosted App Design Workshops for Congressional App Design Challenge
We were excited to recently host App Design 101 workshops at NYSCI in partnership with U.S. Congress Members Alexandria Ocasio-Cortez and Grace Meng. Students were introduced to the design process of creating an app and to the digital tools needed to build it. Students left the workshop energized and excited to submit their app ideas to the Congressional App Design Challenge. App ideas included increasing awareness of mental health, sharing a community’s history, digital tennis lessons, crocheting lessons, and more.
NYSCI Honored to Receive 2023 National Science Board Science and Society Award!
The award is part of a major effort to establishing the AI Institute for Artificial and Natural Intelligence (ARNI), an interdisciplinary center led by Columbia University that will draw together top researchers across the country to focus on a national priority: connecting the major progress made in artificial intelligence (AI) systems to the revolution in our understanding of the brain.
SUBSCRIBE
Don't Miss A Thing
Subscribe to receive special offers, first dibs on new experiences, at-home activities & more!


